Elections in Michigan
The Michigan Senate elections of 2018[1] governor , Class I United States Senator , Attorney General , Secretary of State as well elections for Michigan's 14 seats in the United States House of Representatives and all 110 seats in the Michigan House of Representatives ; to elect the 38 members that will comprise the Michigan Senate. The Republican, Democratic and Libertarian parties chose their nominees in a partisan primary on August 7, 2018.[1] Working Class Party , U.S. Taxpayers Party, Green Party and Natural Law Party chose their nominees at state party conventions.[2]
Term-limited members Under the Michigan Constitution, members of the state Senate are able to serve only two four-year terms, and members of the House of Representatives are limited to three two-year terms. Michigan has what are considered the toughest term-limits in the country.[3] [4]
Democrats (7) Republicans (19) Results Popular vote Democratic
50.25% Republican
48.04% Other
1.71%
Senate seats Republican
57.89% Democratic
42.10%
Closest races Seats where the margin of victory was under 10%:
District 12, 0.78% (gain)District 13, 2.78% (gain)District 7, 3.22% (gain)District 15, 3.38% District 34, 4.41% District 10, 4.79% General election Pending official certification by the Michigan Board of State Canvassers, the following candidates, listed alphabetically, advanced to the November general election.
2 Current member of House 3 Former legislator
District 1 1st District Party Candidate Votes % Democratic Stephanie Chang 2 60,874 72.27% Republican Pauline Montie 20,154 23.93% Green David Bullock 3,204 3.80% Total votes 261,214 100% Democratic hold
District 2 2nd District Party Candidate Votes % Democratic Adam Hollier 53,890 75.71% Republican Lisa Papas 17,285 24.29% Total votes 71,175 100% Democratic hold
District 3 3rd District Party Candidate Votes % Democratic Sylvia Santana 2 58,211 81.75% Republican Kathy Stecker 10,907 15.32% Working Class Hali McEachern 2,089 2.93% Total votes 71,207 100% Democratic hold
District 4 4th District Party Candidate Votes % Democratic Marshall Bullock 57,469 78.36% Republican Angela Savino 15,868 21.64% Total votes 73,337 100% Democratic hold
District 5 District 6 6th District Party Candidate Votes % Democratic Erika Geiss 2 60,783 61.34% Republican Brenda Jones 38,301 38.66% Total votes 99,084 100% Democratic hold
District 7 7th District Party Candidate Votes % Democratic Dayna Polehanki 69,428 50.56% Republican Laura Cox2 65,009 47.34% Libertarian Joseph H. LeBlanc 2,890 2.10% Total votes 137,327 100% Democratic gain from Republican
District 8 8th District Party Candidate Votes % Republican Peter Lucido 2 76,165 61.76% Democratic Paul R. Francis 47,151 38.24% Total votes 123,316 100% Republican hold
District 9 9th District Party Candidate Votes % Democratic Paul Wojno 3 65,730 65.90% Republican Jeff Bonnell 34,012 34.10% Total votes 99,742 100% Democratic hold
District 10 District 11 11th District Party Candidate Votes % Democratic Jeremy Moss 2 97,192 76.43% Republican Boris Tuman 26,829 21.10% Libertarian James K. Young 3,145 2.47% Total votes 127,166 100% Democratic hold
District 12 12th District Party Candidate Votes % Democratic Rosemary Bayer 59,297 49.39% Republican Mike McCready2 58,362 48.61% Libertarian Jeff Pittel 2,403 2.00% Total votes 120,062 100% Democratic gain from Republican
District 13 District 14 14th District Party Candidate Votes % Republican Ruth Johnson 3 64,273 55.68% Democratic Renee Watson 48,580 42.09% Green Jessica Smith 2,580 2.24% Total votes 115,433 100% Republican hold
District 15 15th District Party Candidate Votes % Republican Jim Runestad 2 67,351 51.69% Democratic Julia Pulver 62,935 48.31% Total votes 130,286 100% Republican hold
District 16 16th District Party Candidate Votes % Republican Mike Shirkey 1 56,981 62.71% Democratic Val Cochran Toops 31,129 34.26% Libertarian Ronald A. Muszynski 2,760 3.04% Total votes 90,870 100% Republican hold
District 17 17th District Party Candidate Votes % Republican Dale Zorn (incumbent) 57,947 57.89% Democratic Bill LaVoy 3 39,255 39.21% Libertarian Chad McNamara 2,905 2.90% Total votes 100,107 100% Republican hold
District 18 18th District Party Candidate Votes % Democratic Jeff Irwin3 96,876 76.61% Republican Martin Church 26,619 21.05% Working Class Thomas Repasky 2,954 2.34% Total votes 126,449 100% Democratic hold
District 19 19th District Party Candidate Votes % Republican John Bizon 2 56,213 58.41% Democratic Jason Noble 37,081 38.53% Libertarian Joseph P. Gillotte 2,941 3.06% Total votes 96,235 100% Republican hold
District 20 20th District Party Candidate Votes % Democratic Sean McCann3 60,523 53.09% Republican Margaret O'Brien (incumbent) 48,197 42.28% Libertarian Lorence Wenke 3 5,273 4.63% Total votes 113,993 100% Democratic gain from Republican
District 21 21st District Party Candidate Votes % Republican Kim LaSata 2 56,296 58.20% Democratic Ian Haight 40,433 41.80% Total votes 96,729 100% Republican hold
District 22 22nd District Party Candidate Votes % Republican Lana Theis 2 76,038 55.97% Democratic Adam Dreher 57,163 42.08% Green Eric Borregard 2,658 1.96% Total votes 135,859 100% Republican hold
District 23 23rd District Party Candidate Votes % Democratic Curtis Hertel Jr. (incumbent) 73,184 68.46% Republican Andrea Pollock 33,718 31.54% Total votes 106,902 100% Democratic hold
District 24 24th District Party Candidate Votes % Republican Tom Barrett2 66,969 53.53% Democratic Kelly Rossman-McKinney 54,350 43.45% Libertarian Katie Nepton 2,064 1.65% Constitution Matthew Shepard 1,711 1.37% Total votes 125,094 100% Republican hold
District 25 25th District Party Candidate Votes % Republican Dan Lauwers 2 66,926 63.96% Democratic Debbie Bourgois 37,715 36.04% Total votes 104,641 100% Republican hold
District 26 26th District Party Candidate Votes % Republican Aric Nesbitt 3 61,509 56.67% Democratic Garnet Lewis 43,495 40.08% Libertarian Erwin Haas 2,375 2.19% Green Robert M. Alway 1,153 1.06% Total votes 108,532 100% Republican hold
District 27 27th District Party Candidate Votes % Democratic Jim Ananich (incumbent) 59,108 71.17% Republican Donna Kekesis 23,942 28.83% Total votes 83,050 100% Democratic hold
District 28 28th District Party Candidate Votes % Republican Peter MacGregor (incumbent) 68,749 58.39% Democratic Craig Beach 45,937 39.01% Libertarian Nathan Hewer 3,059 2.60% Total votes 117,745 100% Republican hold
District 29 District 30 30th District Party Candidate Votes % Republican Roger Victory 2 79,323 63.25% Democratic Jeanette Schipper 42,904 34.21% Libertarian Mary Buzuma 3,189 2.54% Total votes 125,416 100% Republican hold
District 31 31st District Party Candidate Votes % Republican Kevin Daley3 63,394 60.24% Democratic Cynthia A. Luczak 41,833 39.76% Total votes 105,227 100% Republican hold
District 32 District 33 33rd District Party Candidate Votes % Republican Rick Outman 3 49,856 58.75% Democratic Mark Bignell 32,375 38.15% Constitution Christopher Comden 2,633 3.10% Total votes 84,864 100% Republican hold
District 34 34th District Party Candidate Votes % Republican Jon Bumstead 3 50,313 50.74% Democratic Poppy Sias-Hernandez 45,941 46.33% Libertarian Max Riekse 2,896 2.92% Total votes 99,150 100% Republican hold
District 35 35th District Party Candidate Votes % Republican Curt VanderWall 2 73,688 63.17% Democratic Mike Taillard 39,923 34.23% Libertarian Timothy Coon 3,031 2.60% Total votes 116,642 100% Republican hold
District 36 36th District Party Candidate Votes % Republican Jim Stamas (incumbent) 71,013 64.29% Democratic Joe Weir 39,440 35.71% Total votes 110,453 100% Republican hold
District 37 37th District Party Candidate Votes % Republican Wayne Schmidt (incumbent) 73,338 58.95% Democratic Jim Page 51,076 41.05% Total votes 124,414 100% Republican hold
District 38 Results by county Results by precinct 40–50%
50–60%
60–70%
70–80%
80–90%
40–50%
50–60%
60–70%
70–80%
38th District Party Candidate Votes % Republican Ed McBroom 3 59,290 54.63% Democratic Scott Dianda 2 47,279 43.57% Green Wade Paul Roberts 1,952 1.80% Total votes 108,521 100% Republican hold
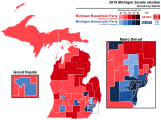
Maps Results shaded by the percentage of the party vote in each district
Support for Republican Party candidates by district
Support for Democratic Party candidates by district
See also References ^ a b Ruth Johnson, Secretary of State. "MICHIGAN ELECTION DATES" (PDF) . Michigan Department of State . ^ Ruth Johnson, Secretary of State. "STATE OF MICHIGAN POLITICAL PARTY STATUS" (PDF) . Michigan Department of State . ^ "Michigan's Term Limits Are Toughest in Nation". The Ballenger Report . October 11, 2016. Retrieved October 29, 2017 . ^ Jonathan Oosting (October 3, 2017). "Mass turnover fuels push for Mich. term limit reform". Detroit News . Retrieved October 29, 2017 . External links 2018 Michigan Primary Election Ballot 


 Results shaded by the percentage of the party vote in each district
 Support for Republican Party candidates by district
 Support for Democratic Party candidates by district


