2006 UK local government election
2006 Epping Forest District Council election
|
|
18 of 58 seats on Epping Forest District Council
30 seats needed for a majority |
|---|
| Turnout | 43.8% ( 6.2%) 6.2%) |
|---|
| | First party | Second party | Third party | | | | | | | Party | Conservative | Liberal Democrats | BNP | | Last election | 26 seats, 42.7% | 14 seats, 30.8% | 3 seats, 3.8% | | Seats before | 26 | 14 | 3 | | Seats won | 29 | 13 | 6 | | Seat change | 3 |  1 1 | 3 | | Popular vote | 13,226 | 7,778 | 1,679 | | Percentage | 43.9% | 25.8% | 5.6% | | Swing | 1.2% | 5.0% | 1.8% |
| | | Fourth party | Fifth party | Sixth party | | | | | | | Party | Loughton Residents | Independent | Labour | | Last election | 6 seats, 12.8% | 3 seats, 3.8% | 4 seats, 4.6% | | Seats before | 6 | 4 | 4 | | Seats won | 5 | 3 | 1 | | Seat change | 1 |  | 3 | | Popular vote | 2,926 | 2,405 | 1,700 | | Percentage | 9.7% | 8.0% | 5.6% | | Swing | 3.1% | 4.8% | 1.0% | |
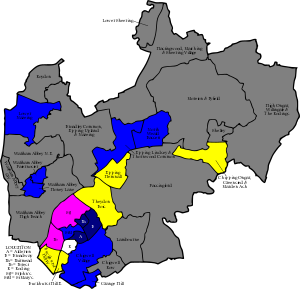 Results of the 2006 District Council elections |
 Council composition following the election |
Council control before election
No overall control
Conservative largest party | Council control after election
No overall control
Conservative largest party | |
Elections to Epping Forest Council were held on 4 May 2006. One third of the council was up for election and the council stayed under no overall control.
The Labour Party was reduced to one seat following wipeout of their representation in Loughton - remaining Labour councillor, Peter Gode of Shelley would resign in 2015. Stephen Murray, Labour councillor for Loughton Roding, defected and became an Independent. This election also marks the most recent time a Conservative has won a seat in Loughton.
The Liberal Democrats lost another seat, whilst the Loughton Residents Association also lost a seat to the British National Party, who doubled their representation and increased their vote share. Three Independents remained on the council, and Chigwell Residents Association councillor, John Knapman (who groups with the Loughton Residents Association) continued to serve out their terms.
This would be the last election in which the Conservatives would not have control of the council. This would change following a by-election in Grange Hill in December 2006 which would see the Conservatives cross the majority threshold and assume control of the chamber.
By-elections
Lower Sheering by-election
Lower Sheering by-election 23 June 2005[1] | Party | Candidate | Votes | % | ±% |
| | Conservative | Heather Harding | 208 | 70.7 | 1.4 |
| | Labour | Benjamin Slasberg | 64 | 21.8 | N/A |
| | Liberal Democrats | John Rumble | 22 | 7.5 | 20.4 |
| Majority | 144 | 48.9 | 4.7 |
| Turnout | 294 | 18.5 | 1.0 |
| | Conservative hold | Swing | | |
Chigwell Village by-election
N.B: The Conservative figure is marked as N/A because the last election this ward was contested in did not feature a Conservative candidate, rather a Chigwell Residents Association candidate
Chigwell Village by-election 30 June 2005[2] | Party | Candidate | Votes | % | ±% |
| | Conservative | Charles Scrutton | 363 | 59.3 | N/A |
| | Liberal Democrats | Alan Lion | 249 | 40.7 | 29.2 |
| Majority | 114 | 18.6 | 49.8 |
| Turnout | 612 | 19.7 | 18.2 |
| | Conservative hold | Swing | | |
Results
Buckhurst Hill East
Buckhurst Hill East | Party | Candidate | Votes | % | ±% |
| | Liberal Democrats | Peter Spencer | 801 | 61.3 | 8.7 |
| | Conservative | George Denny | 506 | 38.7 | 4.8 |
| Majority | 295 | 22.6 | 3.9 |
| Turnout | 1,307 | 40.4 | 0.9 |
| | Liberal Democrats hold | Swing | | |
Buckhurst Hill West
Buckhurst Hill West (2) | Party | Candidate | Votes | % | ±% |
| | Liberal Democrats | Ann Haigh | 1,066 | 51.2 | 0.5 |
| | Conservative | Robert Church | 1,015 | 48.8 | 0.5 |
| | Conservative | Haluk Ulkun | 1,009 | | |
| | Liberal Democrats | Carol Taylor | 970 | | |
| Turnout | 4,060 | 42.7 | 1.5 |
| | Liberal Democrats hold | Swing | | |
| | Conservative gain from Liberal Democrats | Swing | | |
Chigwell Village
Chigwell Village | Party | Candidate | Votes | % | ±% |
| | Conservative | Lesley Wagland | 892 | 80.4 | N/A |
| | Liberal Democrats | Jeffrey Stollar | 217 | 19.6 | 3.8 |
| Majority | 675 | 60.8 | 7.6 |
| Turnout | 1,109 | 35.9 | 2.0 |
| | Conservative hold | Swing | | |
Chipping Ongar, Greensted and Marden Ash
Chipping Ongar, Greensted and Marden Ash | Party | Candidate | Votes | % | ±% |
| | Liberal Democrats | Derek Jacobs | 590 | 39.3 | 18.9 |
| | Conservative | Glyn Pritchard | 560 | 37.3 | 4.5 |
| | English Democrat | Robin Tilbrook | 250 | 16.6 | N/A |
| | Labour | Roger McNulty | 102 | 6.8 | 6.8 |
| Majority | 30 | 2.0 | 14.4 |
| Turnout | 1,502 | 47.8 | 15.1 |
| | Liberal Democrats hold | Swing | | |
Epping Hemnall
Epping Hemnall | Party | Candidate | Votes | % | ±% |
| | Liberal Democrats | Janet Whitehouse | 1,105 | 49.7 | 4.9 |
| | Conservative | Brian Rolfe | 1,002 | 45.0 | 1.9 |
| | Labour | Paul Handford | 118 | 5.3 | N/A |
| Majority | 103 | 4.7 | 7.4 |
| Turnout | 2,225 | 47.5 | 5.5 |
| | Liberal Democrats hold | Swing | | |
Epping Lindsey and Thornwood Common
Epping Lindsey and Thornwood Common | Party | Candidate | Votes | % | ±% |
| | Conservative | Matthew Colling | 1,060 | 58.6 | 3.1 |
| | Liberal Democrats | Janet Hedges | 552 | 30.5 | 5.8 |
| | Labour | Anne Baldwin | 198 | 10.9 | N/A |
| Majority | 508 | 28.1 | 8.9 |
| Turnout | 1,810 | 38.3 | 2.2 |
| | Conservative hold | Swing | | |
Grange Hill
Grange Hill | Party | Candidate | Votes | % | ±% |
| | Conservative | Gagan Mohindra | 908 | 51.6 | 2.3 |
| | Liberal Democrats | Alan Lion | 753 | 42.8 | 3.3 |
| | Independent | Anthony Du Varene | 97 | 5.5 | 5.5 |
| Majority | 155 | 8.8 | 1.0 |
| Turnout | 1,758 | 38.0 | 0.9 |
| | Conservative gain from Liberal Democrats | Swing | | |
Loughton Alderton
Loughton Alderton | Party | Candidate | Votes | % | ±% |
| | BNP | Rodney Law | 518 | 37.6 | 9.6 |
| | Loughton Residents | Rosemary Brookes | 401 | 29.1 | 6.2 |
| | Conservative | Ben Glassman | 226 | 16.4 | 5.9 |
| | Labour | Maureen Boatman | 181 | 13.2 | 6.6 |
| | Liberal Democrats | David Robertshaw | 50 | 3.6 | 3.5 |
| Majority | 117 | 8.5 | 3.4 |
| Turnout | 1,376 | 42.3 | 7.7 |
| | BNP gain from Labour | Swing | | |
Loughton Broadway
Loughton Broadway | Party | Candidate | Votes | % | ±% |
| | BNP | Susan Clapp | 537 | 39.3 | 5.7 |
| | Labour | Thomas Owen | 429 | 31.4 | 4.2 |
| | Conservative | Lorne Daniel | 204 | 14.9 | 9.5 |
| | Independent | Peter Relph | 112 | 8.2 | N/A |
| | Liberal Democrats | Peter Sinfield | 84 | 6.1 | 8.8 |
| Majority | 108 | 7.9 | 1.5 |
| Turnout | 1,366 | 45.0 | 9.2 |
| | BNP gain from Labour | Swing | | |
Loughton Fairmead
Loughton Fairmead | Party | Candidate | Votes | % | ±% |
| | BNP | Peter Turpin | 427 | 34.5 | 7.9 |
| | Loughton Residents | James Dean | 424 | 34.3 | 9.0 |
| | Conservative | Benjamin Murphy | 192 | 15.5 | 2.1 |
| | Labour | Stephen Barnes | 151 | 12.2 | 9.4 |
| | Liberal Democrats | Neil Woollcott | 43 | 3.5 | 5.4 |
| Majority | 3 | 0.2 | 1.1 |
| Turnout | 1,237 | 42.1 | 10.7 |
| | BNP gain from Labour | Swing | | |
Loughton Forest
Loughton Forest | Party | Candidate | Votes | % | ±% |
| | Loughton Residents | Peter House | 734 | 47.8 | 10.7 |
| | Conservative | Matthew Daniel | 654 | 42.6 | 5.4 |
| | Labour | Marion Taylor | 89 | 5.8 | 4.3 |
| | Liberal Democrats | Christopher Spence | 60 | 3.9 | 1.0 |
| Majority | 80 | 5.2 | 5.7 |
| Turnout | 1,537 | 47.7 | 3.4 |
| | Loughton Residents hold | Swing | | |
Loughton Roding
Loughton Roding | Party | Candidate | Votes | % | ±% |
| | Independent | Stephen Murray | 1,087 | 67.5 | N/A |
| | Conservative | Valerie Metcalfe | 229 | 14.2 | 4.2 |
| | BNP | Jacqueline Carne | 197 | 12.2 | N/A |
| | Labour | Louis Appiah | 52 | 3.2 | 11.5 |
| | Liberal Democrats | Peter Fuller | 45 | 2.8 | 11.1 |
| Majority | 858 | 53.3 | 8.7 |
| Turnout | 1,610 | 46.4 | 8.2 |
| | Independent gain from Labour | Swing | | |
Loughton St. John's
Loughton St. John's | Party | Candidate | Votes | % | ±% |
| | Loughton Residents | John Markham | 807 | 56.9 | 3.9 |
| | Conservative | Matthew Hayday | 482 | 34.0 | 0.3 |
| | Labour | Jill Bostock | 84 | 5.9 | 1.4 |
| | Liberal Democrats | Theresa Spence | 46 | 3.2 | 2.1 |
| Majority | 325 | 22.9 | 4.2 |
| Turnout | 1,419 | 44.0 | 3.8 |
| | Loughton Residents hold | Swing | | |
Loughton St. Mary's
Loughton St. Mary's | Party | Candidate | Votes | % | ±% |
| | Conservative | Mitchell Cohen | 687 | 50.2 | 21.3 |
| | Loughton Residents | Rodney Barrett | 560 | 40.9 | 14.4 |
| | Labour | Peter Sheen | 75 | 5.5 | 2.9 |
| | Liberal Democrats | Enid Robinson | 47 | 3.4 | 4.0 |
| Majority | 127 | 9.3 | 30.2 |
| Turnout | 1,369 | 44.0 | 4.5 |
| | Conservative gain from Loughton Residents | Swing | | |
Lower Nazeing
Lower Nazeing | Party | Candidate | Votes | % | ±% |
| | Conservative | Antoinette Cooper | 750 | 56.3 | 27.4 |
| | Independent | Edgar Borton | 437 | 32.8 | 21.8 |
| | Labour | Kelvin Morris | 87 | 6.5 | 4.1 |
| | Liberal Democrats | Ingrid Black | 58 | 4.4 | 0.7 |
| Majority | 313 | 23.5 | 20.9 |
| Turnout | 1,332 | 42.5 | 9.7 |
| | Conservative hold | Swing | | |
North Weald Bassett
North Weald Bassett | Party | Candidate | Votes | % | ±% |
| | Conservative | David Stallan | 1,032 | 82.4 | 2.4 |
| | Liberal Democrats | John Rumble | 221 | 17.6 | 6.0 |
| Majority | 811 | 64.8 | 3.6 |
| Turnout | 1,253 | 35.6 | 9.8 |
| | Conservative hold | Swing | | |
Theydon Bois
Theydon Bois | Party | Candidate | Votes | % | ±% |
| | Liberal Democrats | Roland Frankel | 721 | 46.5 | 6.8 |
| | Conservative | Robert Glozier | 693 | 44.7 | 2.0 |
| | UKIP | Michael McGough | 136 | 8.8 | N/A |
| Majority | 28 | 1.8 | 4.8 |
| Turnout | 1,550 | 49.8 | 1.4 |
| | Liberal Democrats gain from Conservative | Swing | | |
Waltham Abbey Honey Lane
Waltham Abbey Honey Lane | Party | Candidate | Votes | % | ±% |
| | Conservative | Demetrios Demetriou | 640 | 48.5 | 19.2 |
| | Independent | Michael Tobin | 496 | 37.6 | N/A |
| | Liberal Democrats | Peggy Ayre | 184 | 13.9 | 18.4 |
| Majority | 144 | 10.9 | 15.7 |
| Turnout | 1,320 | 30.2 | 3.6 |
| | Conservative hold | Swing | | |
Waltham Abbey Paternoster
Councillor Reginald Chidley, elected as a Conservative in 2002, resigned from the Conservative group and sat as an Independent. He was defeated in this election by a Conservative opponent.
Waltham Abbey Paternoster | Party | Candidate | Votes | % | ±% |
| | Conservative | John Wyatt | 485 | 50.5 | 32.7 |
| | Independent | Reginald Chidley | 176 | 18.3 | N/A |
| | Liberal Democrats | Philip Chadburn | 165 | 17.2 | 0.4 |
| | Labour | Liam Conlon | 134 | 14.0 | N/A |
| Majority | 309 | 32.2 | 34.2 |
| Turnout | 960 | 29.5 | 7.1 |
| | Conservative hold | Swing | | |
References
- ^ "Election results for Lower Sheering". Epping Forest District Council. Retrieved 22 September 2017.
- ^ "Election results for Chigwell Village". Epping Forest District Council. Retrieved 22 September 2017.
- 2006 Epping Forest election result
- Ward results

 6.2%)
6.2%)


 1.4
1.4  Council elections in Essex


