1856 United States presidential election in Maryland
Election in Maryland
 | ||||||||||||||||||||||||||
| ||||||||||||||||||||||||||
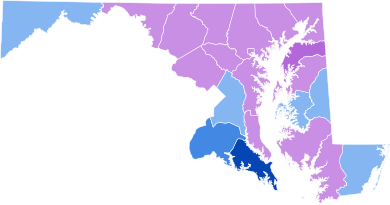 County Results
| ||||||||||||||||||||||||||
| ||||||||||||||||||||||||||


The 1856 United States presidential election in Maryland took place on November 4, 1856, as part of the 1856 United States presidential election. Voters chose eight representatives, or electors to the Electoral College, who voted for president and vice president.
Maryland voted for the Know Nothing candidate, former president Millard Fillmore, over the Democratic candidate, James Buchanan, and Republican candidate, John C. Frémont.
Fillmore won the state by a margin of 9.59%. Maryland was the only state to vote for Fillmore this election. This was the last time until 1948 that a Democrat won the presidency without carrying Maryland.
Results
| 1856 United States presidential election in Maryland[1] | ||||||||
|---|---|---|---|---|---|---|---|---|
| Party | Candidate | Running mate | Popular vote | Electoral vote | ||||
| Count | % | Count | % | |||||
| Know Nothing | Millard Fillmore of New York | Andrew Jackson Donelson of Tennessee | 47,452 | 54.63% | 8 | 100.00% | ||
| Democratic | James Buchanan of Pennsylvania | John C. Breckinridge of Kentucky | 39,123 | 45.04% | 0 | 0.00% | ||
| Republican | John C. Frémont of California | William L. Dayton of New Jersey | 285 | 0.33% | 0 | 0.00% | ||
| Total | 86,860 | 100.00% | 8 | 100.00% | ||||
Results by county
| County | Millard Fillmore Know Nothing | James Buchanan Democratic | John C. Frémont Republican | Margin | Total Votes Cast [2] | ||||
|---|---|---|---|---|---|---|---|---|---|
| # | % | # | % | # | % | # | % | ||
| Allegany | 1938 | 46.30% | 2248 | 53.70% | 0 | 0.00% | -310 | -7.41% | 4186 |
| Anne Arundel | 1043 | 52.94% | 927 | 47.06% | 0 | 0.00% | 116 | 5.89% | 1970 |
| Baltimore (City) | 16900 | 62.60% | 9882 | 36.61% | 214 | 0.79% | 7018 | 26.00% | 26996 |
| Baltimore (County) | 3504 | 52.56% | 3155 | 47.32% | 8 | 0.12% | 349 | 5.23% | 6667 |
| Calvert | 401 | 52.97% | 356 | 47.03% | 0 | 0.00% | 45 | 5.94% | 757 |
| Caroline | 638 | 46.16% | 743 | 53.76% | 1 | 0.07% | -105 | -7.60% | 1382 |
| Carroll | 2348 | 52.74% | 2099 | 47.15% | 5 | 0..11% | 249 | 5.59% | 4452 |
| Cecil | 1884 | 50.25% | 1845 | 49.21% | 20 | 0.53% | 39 | 1.04% | 3749 |
| Charles | 461 | 37.82% | 758 | 62.18% | 0 | 0.00% | -297 | -24.36% | 1219 |
| Dorchester | 1292 | 56.79% | 979 | 43.03% | 4 | 0.18% | 313 | 13.76% | 2275 |
| Frederick | 3724 | 52.83% | 3304 | 46.87% | 21 | 0.30% | 420 | 5.96% | 7049 |
| Harford | 2074 | 59.55% | 1405 | 40.34% | 4 | 0.11% | 669 | 19.21% | 3483 |
| Howard | 899 | 58.68% | 633 | 41.32% | 0 | 0.00% | 266 | 17.36% | 1532 |
| Kent | 833 | 60.23% | 550 | 39.77% | 0 | 0.00% | 283 | 20.46% | 1383 |
| Montgomery | 1208 | 51.76% | 1126 | 48.24% | 0 | 0.00% | 82 | 3.51% | 2334 |
| Prince George's | 881 | 47.26% | 983 | 52.74% | 0 | 0.00% | -102 | -5.47% | 1864 |
| Queen Anne's | 904 | 54.95% | 741 | 45.05% | 0 | 0.00% | 163 | 9.91% | 1645 |
| St. Mary's | 247 | 19.01% | 1052 | 80.99% | 0 | 0.00% | -805 | -61.97% | 1299 |
| Somerset | 1593 | 54.65% | 1321 | 45.32% | 1 | 0.03% | 272 | 9.33% | 2915 |
| Talbot | 749 | 45.15% | 910 | 54.85% | 0 | 0.00% | -161 | -9.70% | 1659 |
| Washington | 2717 | 50.41% | 2670 | 49.54% | 3 | 0.06% | 47 | 0.87% | 5390 |
| Worcester | 1224 | 46.15% | 1428 | 53.85% | 0 | 0.00% | -204 | -7.69% | 2652 |
| Total | 47452 | 54.63% | 39123 | 45.04% | 285 | 0.33% | 8329 | 9.59% | 86860 |
Counties that flipped from Whig to Know Nothing
- Anne Arundel
- Calvert
- Carroll
- Cecil
- Dorchester
- Frederick
- Harford
- Howard
- Kent
- Montgomery
- Queen Anne's
- Somerset
- Washington
Counties that flipped from Democratic to Know Nothing
Counties that flipped from Whig to Democratic
See also
- United States presidential elections in Maryland
- 1856 United States presidential election
- 1856 United States elections
References
State results of the 1856 U.S. presidential election | ||
|---|---|---|
|  | |
| |
|---|---|
| General | |
| Governor |
|
| State Senate | |
| House of Delegates | |
| U.S. President | |
| U.S. Senate |
|
| U.S. House |
|
| Attorney General | |
| Comptroller | |
| County Executive | |
| County offices | |

| |


